Founding Engineer2024 — Present
HolonIQ
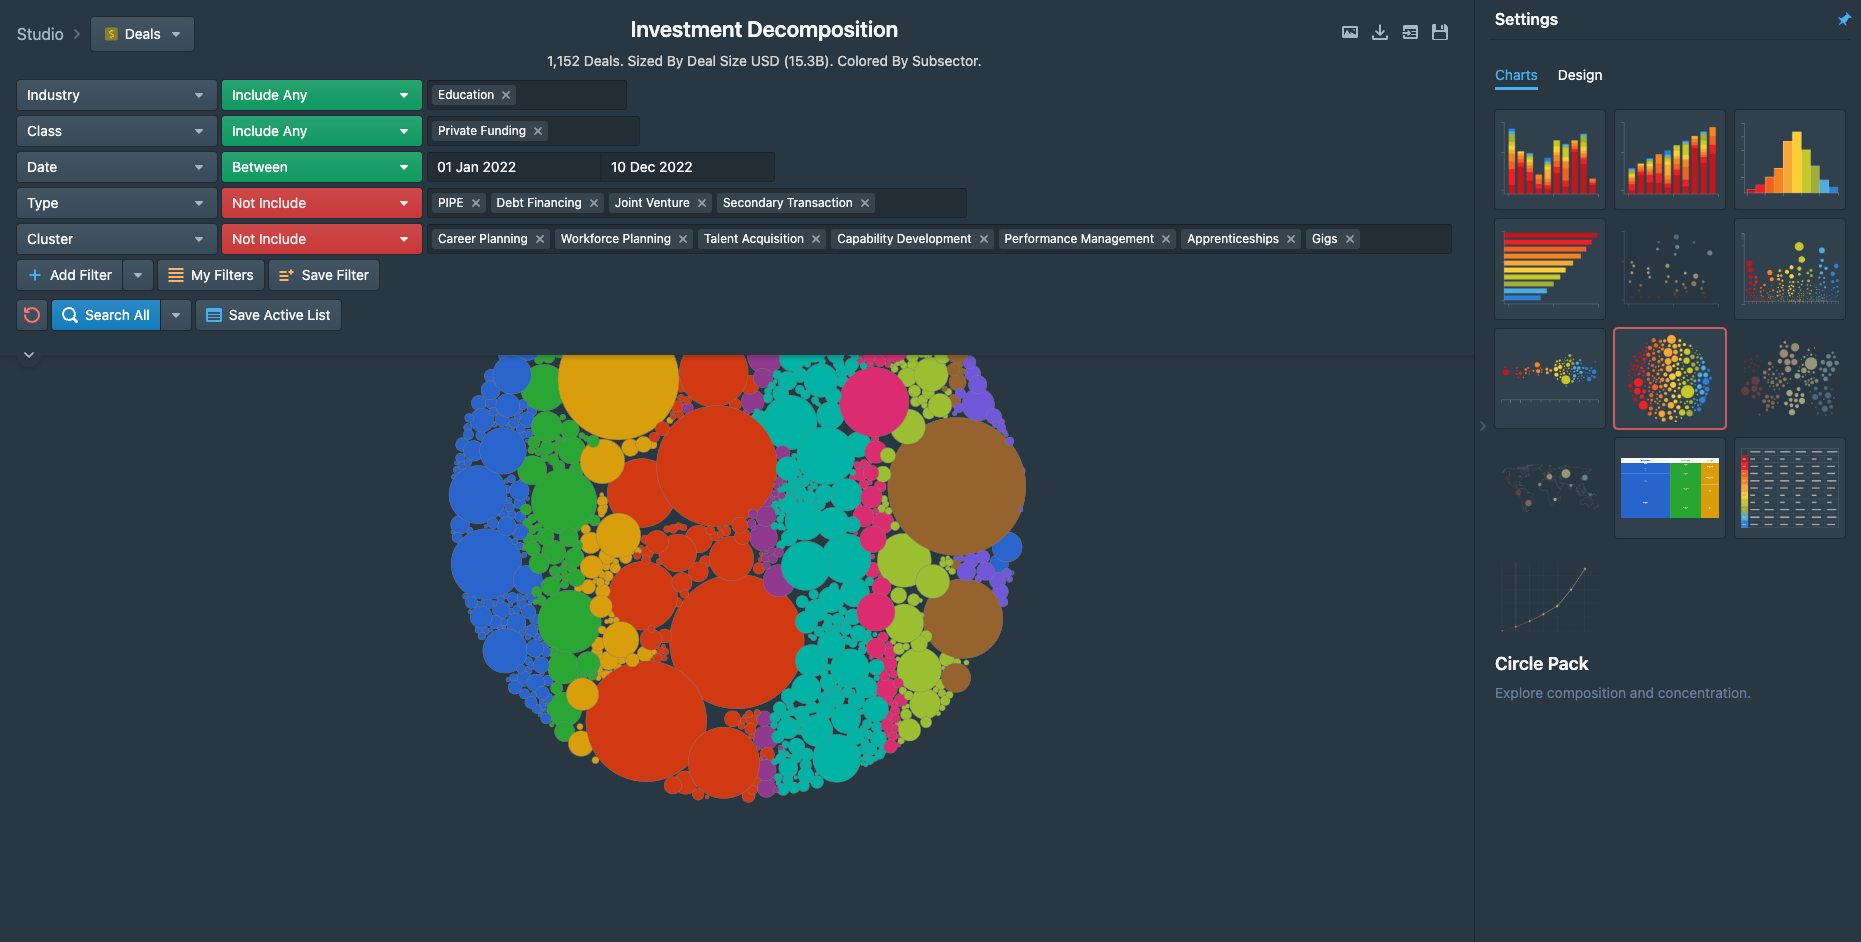
Interactive financial data visualization showing companies, funding rounds and segments. Built as web-based dashboard for analysts and decision-makers.
PythonOpenAINext.js
Overview
HolonIQ is an interactive financial data visualization platform focused on the EdTech market. It maps companies, funding rounds, and market segments into an explorable web-based dashboard used by analysts and decision-makers.
The challenge
Market intelligence teams needed a way to explore complex EdTech funding landscapes without relying on static spreadsheets and fragmented reports.
What I built
Designed and built a dynamic visualization layer on top of structured funding data, enabling analysts to filter by segment, round size, and geography in real time.
Outcome
- Consolidated fragmented funding data into a single explorable view
- Accelerated market research with interactive segment filtering
- Delivered a web-based dashboard accessible to remote analyst teams